
Problem Set 1 Task 2 (Matt & Aaron)


Figure 1.2.2
|

Figure 1.2.3
|

Figure 1.2.4 Hover Test - Coefficient of Thrust Calculation
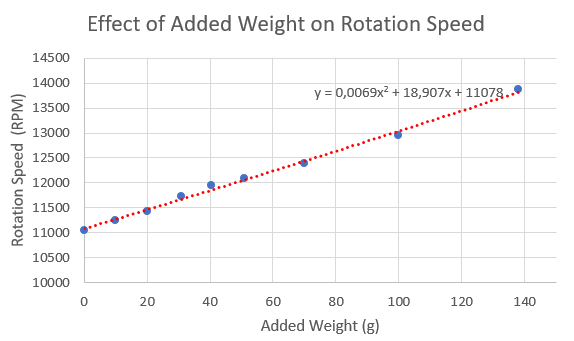
Figure 1.2.5 Effect of adding weight on the rotor rotation speed
|

Figure 1.2.6 - Hover Test - Heaviest Configuration - 138g
|

Figure 1.2.7 - CG Measurement Configuration
|

Figure 1.2.8 - CG Measurement Sample Load
|


